How to use LLMs with spreadsheets
[Paper: SPREADSHEETLLM: Encoding Spreadsheets for Large Language Models
Summary by Adrian Wilkins-Caruana
When I hear people say “AI is going to take all our jobs,” what I think they mean is that LLMs like ChatGPT will automate more and more tasks to the point where many tasks don’t require a human anymore. There’s a bit of hand-waving involved in that inference, but I think it’s pretty fair. But LLMs are just text generators, and most jobs involve more than just pressing keys on a keyboard. So, how can we use LLMs to, say, automate a job that involves manipulating spreadsheets? How would it read the spreadsheet, let alone use it to answer questions about the data? Today’s summary is about a new method that lets an LLM do exactly that.
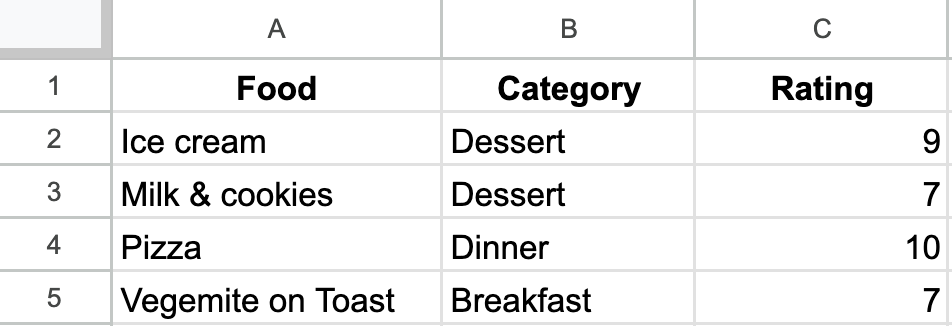
Let’s pretend that we are AI engineers and our job is to make an LLM manipulate a spreadsheet. How might we do this? One way might be to describe each cell using text. Let’s use this approach to describe a very important spreadsheet of mine:
We can describe this spreadsheet like this:
The following text describes a spreadsheet for tracking foods and their ratings. Here’s the data:
Cell A1. Text: “Food”. Formula: None. Formatting: Bold, and centered.
Cell A2. Text: “Ice cream”. Formula: None. Formatting: None.
Cell A3. Text: “Milk & cookies”. Formula: None. Formatting: None.
…
We could then ask the LLM to do some work for us, like “Please tell me how to calculate the average rating,” and it might say:
Cell B6. Text: None. Formula: "=Average(C2:C5)". Formatting: "Numeric, two decimal places".
There are, however, two main issues with this naive approach and others like it: It’s unnecessarily verbose, and its index-first structure isn’t ideal for an LLM. The next bit of this summary explores some clever techniques — developed by Microsoft researchers — to fix these problems.
When you make a spreadsheet, do you use whitespace/empty cells to delineate particular tables or separate different kinds of info? So do I! But it turns out that this whitespace is really unhelpful for an LLM, since it adds a lot of useless, distracting information to a text-encoded spreadsheet. So the researchers came up with a technique called structural anchors, a heuristic-based algorithm that essentially draws boxes around useful information in a spreadsheet. The method then extracts the cells inside these anchors (and a little bit outside the anchors, just in case the structure isn’t perfect), and remaps the addresses so that they make sense without the whitespace.
Continuing on the theme of “things about spreadsheets that humans like but LLMs don’t” are the 2d matrix format, our repetition of some values (e.g., “Dessert” in my spreadsheet), and that we sometimes scatter useful bits of info at seemingly random places. The researchers found that LLMs, being the language-lovers that they are, much prefer a dictionary-like format. So, the researchers created an inverse index–based translation method that flips a spreadsheet on its head. It uses the values of the cells as the primary keys, not the cell indexes. The dictionary values are lists of cell indexes, so the encoding can easily represent repeated values. My spreadsheet above might look like this:
{
    “Food”: A1,
    “Category”: B1,
    “Rating”: C1,
    “Ice cream”: A2,
    “Dessert”: B2, B3,
    “9”: C2,
    ...
}
The researchers realized one more way they could better represent the spreadsheet for an LLM. To understand this trick, keep in mind that spreadsheet-aware LLMs don’t actually have to do any computing on their own, because they can produce commands that are executed by the spreadsheet software. In other words, they simply ask the spreadsheet to perform the calculations, just as a human would. Because of this, the LLM doesn’t need to know the specific numeric values of the cells — it just needs to know what format they are (for example, an integer). So the encoding can represent numeric cells — like integers, floating point numbers, percentages, dates, etc. — using some text that describes their format. In my example above, the encoding represents the Rating values in the dictionary format like this: "IntNum: C2:C5".
Overall, these three tricks reduce the number of tokens needed to represent the spreadsheet by 25x compared to one of the naive encoding methods the researchers considered. They tested their approach on a Spreadsheet QA task, and found that regardless of which base LLM they used (e.g., Llama 3, Mistral 3, GPT-4, etc.), LLMs that use these techniques equalled or outperformed the existing spreadsheet analyzing technique, called TableSense-CNN. The GPT-4 model had the best F1 score on this benchmark, on average scoring 9% higher (76%) than TableSense-CNN (67%).
The researchers also conducted ablation experiments, individually excluding one of their three techniques (anchoring, inverse-index/dictionary encoding, and data type aggregation). While the first two techniques tended to improve the F1 scores with GPT-4, surprisingly, the last technique actually made the F1 scores slightly worse; the best score achieved on their benchmark was 79%, using GPT-4 without aggregation. The researchers hypothesize that this might be because the data types are a bit too abstract for the LLM. Nonetheless, they suggest that the aggregation could be necessary for some models that have a limited context length, since the aggregation reduces the number of tokens the model needs to represent the spreadsheet significantly.
I think it’s remarkable that an LLM can work with spreadsheets so well considering that spreadsheets are fundamentally designed for humans, not computers. It seems to me that a spreadsheet is really an unsuitable tool for an LLM to use for solving problems. Still, the techniques presented in this paper could be really helpful to humans when we use spreadsheet software. For example, we could use it to ask questions like “How can I forecast next month’s expenses?” or “When will we break even?” Given that this paper comes from Microsoft researchers, I’m sure that such features are coming to Excel soon!


